

In the world of marine science, the latest news from the Ocean Observatories Initiative (OOI) marks a significant shift in how we observe the 70% of our planet that stays hidden under the waves. If you have been following the project, you know it is less of a single event and more of a continuous, high-fidelity conversation with the deep sea. It is a massive network of sensors, cables, and moorings designed to provide a 25-year constant stream of data.
But the real story isn't just that the sensors are there; it is how that data is finally becoming usable for the rest of us. For anyone interested in how large-scale infrastructure meets software, the OOI is a masterclass in persistence and technical evolution.
The Infrastructure of the Deep
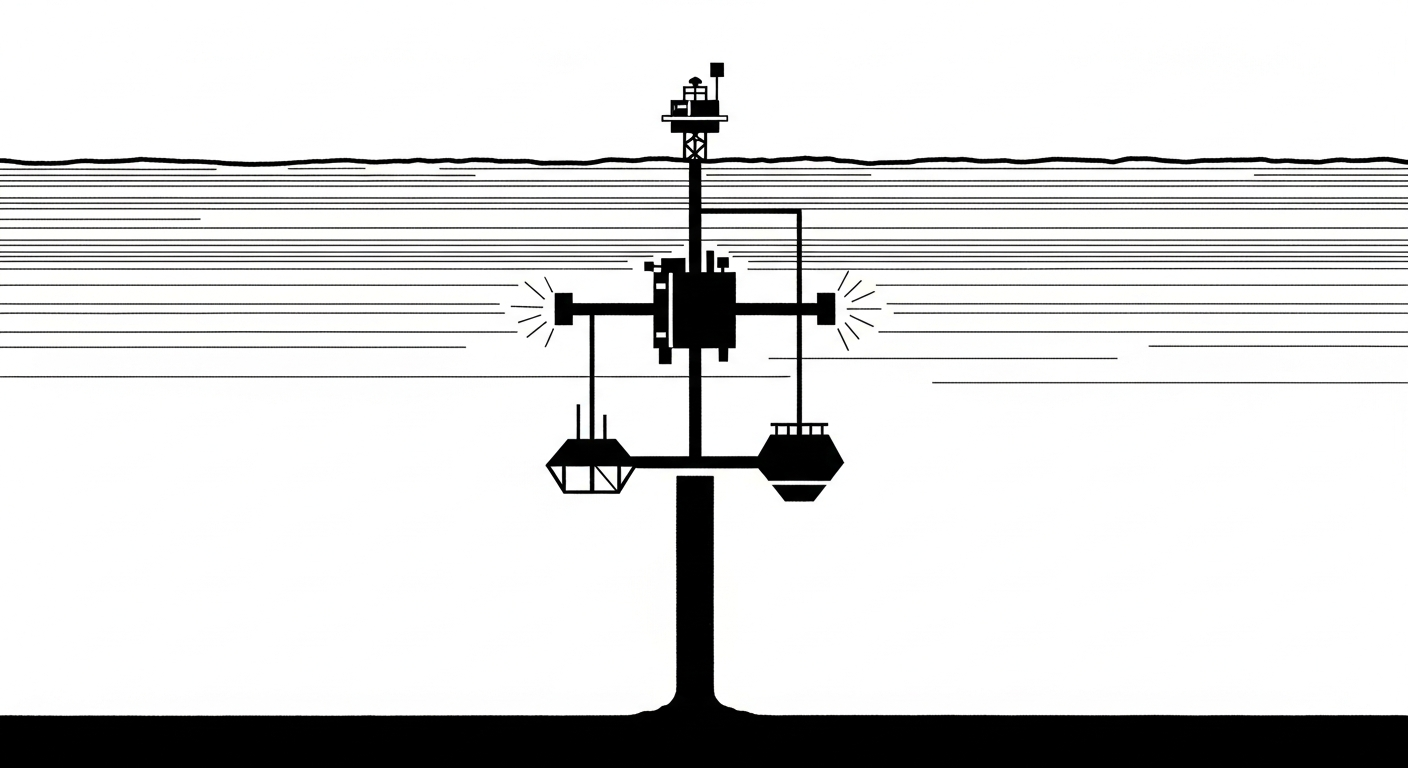
To understand why this news matters, you have to understand the scale of what the OOI actually is. It is not just a few buoys floating in the Atlantic. It is a distributed network of seven different arrays, ranging from the North Atlantic to the Northeast Pacific.
At the heart of the operation is the Regional Cabled Array (RCA). Imagine 900 kilometers of fiber-optic cable snaking across the seafloor, providing 10 gigabits per second of bandwidth and high power to instruments sitting on an active volcano. This isn't a battery-powered logger that you have to retrieve in six months; it is a live, plugged-in laboratory.
When we talk about the OOI, we are talking about over 800 instruments. These include CTDs (conductivity, temperature, depth), ADCPs (acoustic Doppler current profilers), and bio-optical sensors that measure the very breath of the ocean. The challenge has always been: how do you take that firehose of raw, often messy data and turn it into something a person can actually use?
The Cyberinfrastructure Shift
For a long time, the OOI’s biggest hurdle was its own complexity. The data was there, but finding it felt like a chore. The recent news regarding the OOI’s cyberinfrastructure suggests that the team has been listening to the community.
The transition to the "Data Explorer" tool has been a significant step forward. If you have ever tried to navigate the older M2M (machine-to-machine) interfaces, you know the friction that existed. The new interface is cleaner, faster, and—most importantly—it prioritizes the user’s ability to visualize data before they commit to a massive download.
This is a shift from "here is everything we have" to "here is what you are looking for." It’s a subtle distinction, but for a developer or a researcher, it’s the difference between a tool that sits on the shelf and one that gets used every day. They have improved the metadata, made the search functions more intuitive, and streamlined the way data is served via ERDDAP servers.